Money creation, bank profits, and central bank digital currency
Dirk Niepelt 05 February 2021
Source: https://voxeu.org/article/money-creation-bank-profits-and-central-bank-digital-currency
Banks create deposit money, which is a cheap source of funding because deposits serve as a means of payment whose liquidity compensates for yield (e.g. McLeay et al. 2014). Many commentators have reservations about such private money creation. They argue that private banks reap the benefits of publicly provided central bank money by leveraging deposit insurance and lender-of-last-resort guarantees. Others disagree and contend that banks themselves produce liquidity and add value.
Either way, it is natural to ask how much banks profit from the deposit liquidity spread. In a recent paper (Niepelt 2020c), I provide an answer by developing a method to quantify the funding cost reduction. I find that for the US, it is in the order of half a percent of GDP. This has important implications for the discussion about central bank digital currency because the deposit spread takes (or should take) centre stage in that discussion.
Central bank digital currency and bank funding
While more and more central banks examine the introduction of digital currencies, many governing boards are concerned about ‘bank disintermediation’.1 After all, the introduction of ’reserves for all’ would likely lead households and firms to convert some of their bank deposits into digital currency. But this would not imply a loss of bank funding, at least on impact. If a depositor transferred funds from her bank to the central bank, the latter would automatically refinance the former (by accepting the incoming payment). A central bank loan to the bank would ‘back’ the newly created central bank digital currency.2
The key question is at what interest would the central bank charge? If it charged an equivalent loan interest rate that replicated the bank’s deposit financing conditions, then central bank digital currency would leave the bank’s environment essentially unchanged.3
Funding cost reductions from money creation
I exploit this equivalence logic to quantify banks’ funding cost reduction due to money creation. The argument proceeds in three steps.
First, I derive a model-independent measure of the equivalent central bank loan rate. This rate renders a bank indifferent between deposit financing under the status quo, or the central bank loan in a world with central bank digital currencies:
- Under the status quo, the bank issues deposits at a (possibly set) deposit interest rate; invests a share in central bank reserves, which pay another rate; and invests the remainder in projects, which yield yet another rate of return. The bank may also bear operating costs for payment services which are connected to the bank’s deposit base.
- In the central bank digital currency world, customers convert some deposits into digital but a central bank loan replaces them (net of the share of deposits that was invested in reserves). Since the net costs of deposit funding reflect the interest rates on deposits and reserves, the reserves-to-deposits ratio, as well as the operating costs the equivalent central bank loan interest rate, depends on each of these factors as well.
Second, I compute by how much the bank funding rate would differ in the central bank digital currency world if the central bank charged the risk-free interest rate rather than the equivalent loan rate:
- The difference is simply the spread between the risk-free rate and the equivalent loan rate, and it reflects the profitability of private money creation. If the risk-free rate exceeds the equivalent loan rate then deposit funding is cheaper for banks than funding at the risk-free rate (due to deposits’ liquidity value for depositors).
Finally, I conclude that, relative to GDP, the funding cost reduction under the status quo that banks enjoy because they issue deposits rather than non-liquid liabilities equals the product of two terms:
- The spread between the risk-free rate and the equivalent loan rate discussed above.
- The GDP-share of banks’ net funding from money creation. That is, the GDP-share of deposits net of reserve holdings.
This funding cost reduction can be interpreted as an implicit subsidy for banks. After all, in the equivalent central bank digital currency world, it is solely the central bank which provides liquidity for households and firms, not commercial banks.
Large and volatile implicit bank subsidies
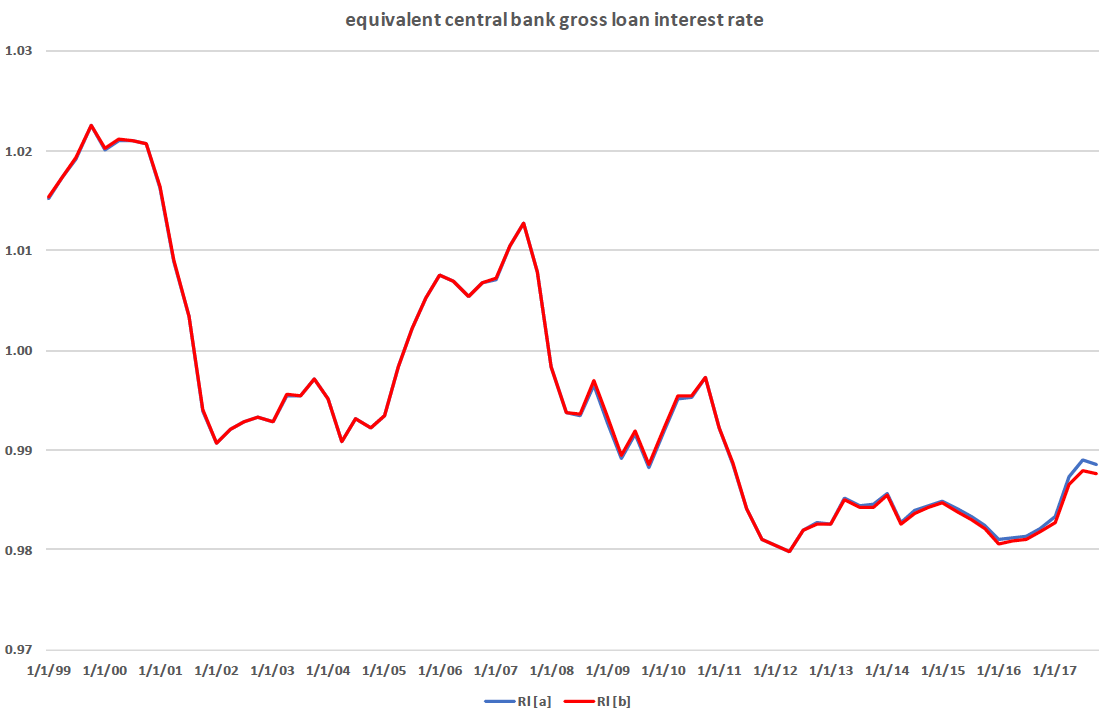
Figure 1 displays two estimates (reflecting alternative measures of deposits) of the equivalent central bank gross loan interest rate in the US during the period 1999—2017.4 Both series are inflation adjusted and constructed under the assumption that operating costs equal 1% (in line with estimates in existing research). That is, I posit that it costs banks 1% to operate payments associated with a dollar of deposit funding.
Figure 1

The figure shows that the equivalent loan rate falls from nearly 2% early in the sample to -0.5% towards the end, with a temporary increase to 1% in late 2010. We can distinguish four phases:5
- Prior to 2008, the reserves-to-deposits ratio is tiny and the equivalent loan rate follows the deposit rate as a result.
- In 2008, the reserves-to-deposits ratio increases substantially, and this pushes the equivalent loan rate up as well.6 One dollar of net funding now requires more than one dollar of deposits – since the deposit rate exceeds the interest rate on reserves, the equivalent loan rate rises.
- Between 2009 and 2015, the interest rates on reserves and deposits practically coincide. As a consequence, the equivalent loan rate follows the interest rate on reserves, plus a factor that reflects operating costs.
- Finally, after 2015 the deposit rate falls below the reserves rate and this contributes negatively to the equivalent loan rate.
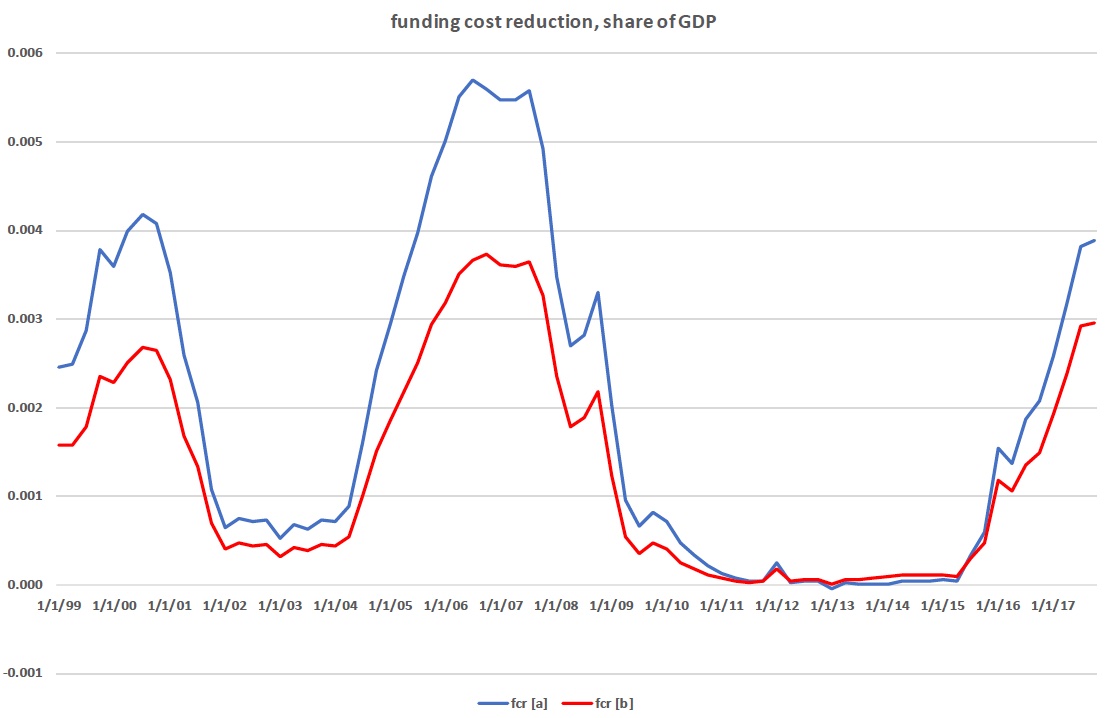
Figure 2 illustrates the implied funding cost reduction or implicit subsidy for banks. Again, the two series correspond to alternative measures of deposits. The time series fluctuate between 0.8% and -0.7% of GDP, reflecting two major drivers. On the one hand, it highlights a trend reduction in the risk-free interest rate relative to the equivalent loan rate, and fluctuations in the difference between the two rates. The trend effect reduces the profitability of private money creation. And on the other hand, there is the inverse-U shaped path of the reserves-to-deposits ratio after 2008 and an increasing deposits-to-GDP ratio.
Figure 2

Again, we can distinguish several phases:
- In the beginning of the sample, money creation by banks reduces their funding costs by roughly 0.5% of GDP (because the risk-free rate exceeds the cost of deposit funding). Equivalently, banks benefit from the equivalent central bank loan in the central bank digital currency world because the risk-free rate exceeds the equivalent loan rate.
- Between 2002 and 2004, the risk-free rate is lower and, as a consequence, the spread between the risk-free rate and the equivalent loan rate turns negative, as does the funding cost reduction.
- In 2005 and 2006, the risk-free interest rate rises again, pushing the spread and the funding cost reduction strongly back into positive territory where they remain until 2008.
- In early 2009, the interest rate spread turns negative and the funding cost reduction remains negative for eight years.
- Only in 2017 does the spread and the funding cost reduction become positive again, following a rise in the risk-free interest rate relative to the deposit rate and the equivalent loan rate.
Figures 3 and 4 are parallel to Figures 1 and 2. The only difference between the two pairs concerns the posited operating costs of depository institutions. Rather than assuming that payment operations cost banks 1% of their deposit volume, I now use a model to ‘back out’ operating costs, given banks’ choices of deposits and reserves holdings.
Figure 3 shows that the implied equivalent loan rate again displays a downward trend, falling by roughly three percentage points over the sample period, with a temporary reversal before the financial crisis (that is, earlier than under the previous calibration). The implied funding cost reduction varies between zero and 0.5% of GDP (Figure 4). It is positive at all times because in this setting the equivalent loan rate happens to always lie below the risk-free interest rate.
Figure 3

Figure 4

Conclusion
Either calibration implies that money creation substantially contributes to bank profits. Between 1999 and 2017 the funding cost reduction for US banks amounted to roughly 0.4 to 0.8% of GDP just before and around the financial crisis. In contrast, banks did not benefit from cost reductions (or they even bore additional funding costs) once financial markets had calmed. These numbers compare with NIPA data for financial sector profits on the order of 3% of GDP prior to the financial crisis, negative profits during the crisis, and 2-3% after the financial crisis.
In a world with full substitution of central bank digital currency for deposits, bank profits would have been the same as in the data had the Federal Reserve financed banks at the equivalent loan rate. Had the Federal Reserve refinanced banks at the risk-free interest rate instead, bank profits would have been substantially lower before, but not after, the financial crisis.
References
Auer, R, G Cornelli and J Frost (2020), “Rise of the central bank digital currencies: Drivers, approaches and technologies”, BIS working paper 880.
Brunnermeier, M K and D Niepelt (2019), “On the equivalence of private and public money”, Journal of Monetary Economics 106.
Kurlat, P (2019), “Deposit spreads and the welfare cost of inflation”, Journal of Monetary Economics 106.
Lucas, R E and J-P Nicolini (2015), “On the stability of money demand”, Journal of Monetary Economics 73.
McLeay, M, A Radia and R Thomas (2014), “Money creation in the modern economy”, Bank of England Quarterly Review, Q1.
Niepelt, D (2019), “Libra paves the way for central bank digital currency”, VoxEU.org, 12 September.
Niepelt, D (2020a), “Digital money and Central Bank Digital Currency: An executive summary for policymakers”, VoxEU.org, 3 February.
Niepelt, D (2020b), “Reserves for All? Central bank digital currency, deposits, and their (non)-equivalence”, International Journal of Central Banking 16(3).
Niepelt, D (2020c), “Monetary policy with reserves and CBDC: Optimality, equivalence, and politics”, CEPR Discussion Paper 15457.
Endnotes
1 See Auer et al. (2020) for an overview of CBDC projects. For a summary of pros and cons of CBDC and private sector alternatives, see Niepelt (2019, 2020a).
2 If the bank held reserves then its account at the central bank would be debited instead. The bank’s balance sheet would shorten but it would not suffer from a shortage of funds.
3 In fact, under broad conditions, CBDC would not have any macroeconomic consequences (Brunnermeier and Niepelt 2019, Niepelt 2020b, 2020c). If deposits are not collateralised, ‘neutrality’ requires the central bank loan to be uncollateralised as well.
4 I use FRED data for the interest rate on reserves; Kurlat’s (2019) estimates of the risk-free, “illiquid” interest rate and the deposit rate; and FRED data as well as data constructed by Lucas and Nicolini (2015) for reserves and deposits. Following Lucas and Nicolini (2015) I use two alternative measures for the deposit series: The sum of checkable and savings deposits, or the sum of checkable deposits and money market deposit accounts.
5 Simplifying a bit, the formula for the equivalent gross loan interest rate reads:
Rl = Rr + (Rn-Rr) / (1-z) + c / (1-z).
Here, Rl, Rr, and Rn
denote the gross interest rates on the central bank loan, reserves, and
deposits, respectively. c and z denote the unit operating cost and
reserves-to-deposits ratio, respectively.
6 The reserves-to-deposits ratio increases from a very low level (at which it had been since the early 1980s) to a maximum of 30% or 45%, depending on the deposit measure, in mid 2014. It reverts to 20% or 30% by the end of 2017.


Nessun commento:
Posta un commento